Introduction
Welcome to "Buffer Overflows and You." Today we're going to talk about computers. In particular, I'd like to focus on something called a "buffer overflow." What does that mean? Well, let's start by taking a step back and looking at your average computer program.
A modern computer generally runs one "master process," the operating system. The OS is responsible for managing all of the machine's resources, such as memory, disk, access to the video card and other peripherals, etc. The OS also provides an abstraction that makes it easier for developers to write programs to run on the computer without needing intimate knowledge about the machine's architecture.
Virtual memory
In the context provided by the operating system, many other "user" processes are running. Because multiple processes are running at what can be considered essentially the same time*, the OS must provide protection between processes. One protection mechanism that modern operating systems and architectures provide is called virtual memory. Through hardware support and additional code in the operating system, virtual memory allows each user process to act as though it is the only thing running on the computer. It gives each process a completely separate address space.
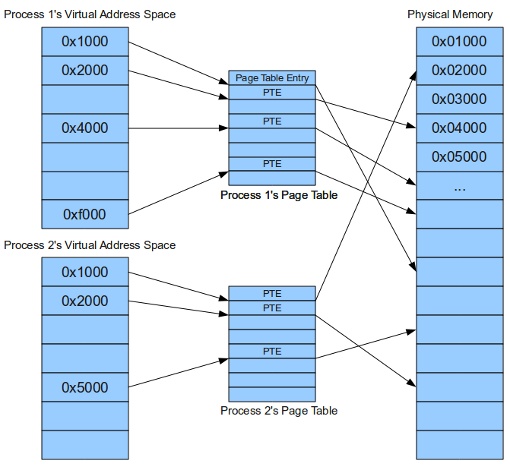
This is facilitated through the use of page tables, as illustrated above. Page tables map the virtual addresses used by the running process into physical addresses that correspond to actual memory. It's good to know this information when looking at a particular process' address space. You'll notice that if you look at the memory map for two different processes there are a lot of common addresses. Let's try it out...
First let's create a really simple program. Copy this code into a file called "sample1.c"
#include <stdio.h>
#include <unistd.h>

int main() {
  char c;

  printf("I am a running instance, or process, of program 1.\n");
  printf("My PID is %d\n", getpid());
  printf("Press enter to exit...\n");
  c = getchar();

  return 0;
}
Now let's run it...
$ gcc -o sample1 sample1.c
$ ./sample1
I am a running instance, or process, of program 1.
My PID is 23814
Press enter to exit...
This creates a single instance of the program, called a process, with the shown PID. You'll probably see a different number for the PID. They're assigned sequentially as programs run. Let's look at this process' memory map in a separate terminal, with the process still running:
$ pmap 23814  # If you don't have pmap installed, use 'cat /proc/23814/maps'
23814:   ./simple1
0000000000400000      4K r-x--  /home/turkstra/cs526/simple1
0000000000600000      4K rw---  /home/turkstra/cs526/simple1
0000003191400000    120K r-x--  /lib64/ld-2.11.1.so
000000319161d000      4K r----  /lib64/ld-2.11.1.so
000000319161e000      4K rw---  /lib64/ld-2.11.1.so
000000319161f000      4K rw---    [ anon ]
0000003191800000   1468K r-x--  /lib64/libc-2.11.1.so
000000319196f000   2048K -----  /lib64/libc-2.11.1.so
0000003191b6f000     16K r----  /lib64/libc-2.11.1.so
0000003191b73000      4K rw---  /lib64/libc-2.11.1.so
0000003191b74000     20K rw---    [ anon ]
00007f09d02ce000     12K rw---    [ anon ]
00007f09d02f2000     12K rw---    [ anon ]
00007fff14cb7000     84K rw---    [ stack ]
00007fff14d00000      4K r-x--    [ anon ]
ffffffffff600000      4K r-x--    [ anon ]
 total             3812K
Let's look at the memory map for another running program, our shell...
$ pmap $$   # $$ is the pid of the currently running process (your shell)
27379:   -bash
0000000000400000    836K r-x--  /bin/bash
00000000006d0000     40K rw---  /bin/bash
00000000006da000     20K rw---    [ anon ]
0000000001dc4000    396K rw---    [ anon ]
0000003191400000    120K r-x--  /lib64/ld-2.11.1.so
000000319161d000      4K r----  /lib64/ld-2.11.1.so
000000319161e000      4K rw---  /lib64/ld-2.11.1.so
000000319161f000      4K rw---    [ anon ]
0000003191800000   1468K r-x--  /lib64/libc-2.11.1.so
000000319196f000   2048K -----  /lib64/libc-2.11.1.so
0000003191b6f000     16K r----  /lib64/libc-2.11.1.so
0000003191b73000      4K rw---  /lib64/libc-2.11.1.so
0000003191b74000     20K rw---    [ anon ]
0000003192000000      8K r-x--  /lib64/libdl-2.11.1.so
0000003192002000   2048K -----  /lib64/libdl-2.11.1.so
0000003192202000      4K r----  /lib64/libdl-2.11.1.so
0000003192203000      4K rw---  /lib64/libdl-2.11.1.so
00000031a0c00000    116K r-x--  /lib64/libtinfo.so.5.7
00000031a0c1d000   2048K -----  /lib64/libtinfo.so.5.7
00000031a0e1d000     16K rw---  /lib64/libtinfo.so.5.7
00007ffdbed49000     48K r-x--  /lib64/libnss_files-2.11.1.so
00007ffdbed55000   2044K -----  /lib64/libnss_files-2.11.1.so
00007ffdbef54000      4K r----  /lib64/libnss_files-2.11.1.so
00007ffdbef55000      4K rw---  /lib64/libnss_files-2.11.1.so
00007ffdbef56000  96452K r----  /usr/lib/locale/locale-archive
00007ffdc4d87000     12K rw---    [ anon ]
00007ffdc4da4000      8K rw---    [ anon ]
00007ffdc4da6000     28K r--s-  /usr/lib64/gconv/gconv-modules.cache
00007ffdc4dad000      4K rw---    [ anon ]
00007fff28c16000     84K rw---    [ stack ]
00007fff28d5f000      4K r-x--    [ anon ]
ffffffffff600000      4K r-x--    [ anon ]
 total           107920K
Notice how even though both processes are running at the same time, they both start at the same address - 0x00400000 in this example. This is possible because of virtual memory. They both start at the same virtual address. But each individual virtual address points to a different physical address as mentioned above.
Process memory layout
Okay, great! Let's talk about the general layout of a program in memory.
On your standard Linux system, it looks something like this [1] ...
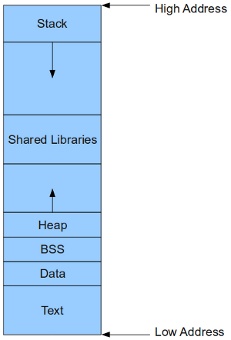
It is worth noting that this layout is mostly for 64-bit systems. On 32-bit systems the shared libraries are usually found at the lowest address, followed by the text segment, then everything else.
The text, or code, segment contains the actual program and any statically linked libraries. On 64-bit systems it generally starts at 0x400000 (32-bit systems like to place it at 0x8047000).
The data and BSS segments come next. The data segment contains all initialized global variables as well as static strings (eg, those used in printf). The BSS, or "block started by segment" region holds all uninitialized global variables (those which by C convention are initialized automatically to 0).
After that comes the heap, where all memory obtained via malloc() is located. The heap grows upwards as more memory is requested.
Then we have any shared libraries such as the loader, libc, malloc, etc.
Finally we have the stack, which it should be noted grows downward as it expands.
There is no heap in our sample programs because we don't ever call malloc(). If you add a malloc() call to the sample program and run it again, you'll see that memory has also been allocated for a heap.
* Really, there's no need to get into a discussion about context switching, preemption, and multitasking. Really.