Making our lives simpler
Let's do a couple of things now to make things easier for us. First, run the following as root:
echo 0 > /proc/sys/kernel/randomize_va_space
Second, whenever we compile a program from now on be sure to add the following two command line options:
-fno-stack-protector -z execstack
We'll talk more about these in the Defenses section.
Your friend, the downward-growing stack
If you recall from the introduction, there were a number of regions in a process' address space. The one of interest to us for the time being is the stack. Programs use the stack to store temporary, or automatic variables, arguments passed during a function call, and information needed to return to a previous point in the program when a function call is made.
There are also three registers that are important at this point - RBP, RSP, and RIP. RSP is the stack pointer. The stack works just like a LIFO queue with push() and pop() operations. RSP tracks the next available position in this queue.
Having one giant queue can get fairly complicated when debugging, say, a deeply recursive function. So, to make things easier, we introduce the notion of a "stack frame." The stack frame is essentially the region of the stack that is presently active, or that corresponds to the presently executing function. It is pointed to by RBP, the "base pointer," and is used in combination with an offset to reference all local variables. Every time a function is called, RBP is updated to point to its stack frame.
Finally, RIP is the instruction pointer. It holds the address of the instruction that the CPU just loaded and is presently executing.
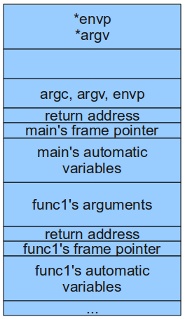
The diagram above shows a snapshot of the stack for a program that is presently in func1(), which was called from main(). In order for the stack to look this way, some things must have happened when func1() was called. These steps are defined by the C calling convention. [2]
1. The arguments to func1() were pushed onto the stack.
2. func1() was called.
3. RBP was pushed onto the stack.
4. RSP was moved to RBP.
5. Space for the local variables was allocated on the stack.
6. Local variables were set to initial values (if provided).
Steps 3 through 6 are called the function prelude.
Pretty pictures are nice, you say, but is it really like that? Well, let's write a program to take a look. First start by throwing this in a file called "walk.c."...
#include <stdio.h>

void walk(void *a, int bytes)
{
  int i;
  int j;
  char *addr = a;

  /* Make sure address is 8-byte aligned */
  while (((long)addr) % 8) addr++;

  for (i = 0; i < bytes / 8; i++)
  {
    printf("%p: ", addr);

    /* Print hex values */
    for (j = 0; j < 8; j++)
      printf("%02hhx ", addr[j]);

    /* Print ascii values */
    for (j = 0; j < 8; j++)
      printf("%c", isprint(addr[j]) ? addr[j] : '?');

    addr -= 8;
    printf("\n");
  }
  return;
}
The function above allows us to dump / display values stored at a given address in memory. So let's write a simple program and "walk" its stack...
#include "walk.c"

void hello(int value) {
  int local = 0xdecafbad;

  walk(&local+16, 112);
}

int main(int argc, char *argv[], char *envp[]) {
  int local = 0xbeefbeef;

  printf("Address of main is %p\n", main);
  printf("Address of local is %p\n", &local);
  hello(0xaaaaaaaa);

  return 0;
}
Now let's compile and run it...
$ gcc -fno-stack-protector -z execstack -o doit doit.c
$ ./doit
Address of main is 0x400678
Address of local is 0x7fffffffe43c
0x7fffffffe440: 00 00 00 00 00 00 00 00 ????????
0x7fffffffe438: 00 00 00 00 ef be ef be ????????
0x7fffffffe430: 20 e5 ff ff ff 7f 00 00  ???????
0x7fffffffe428: 70 04 40 00 01 00 00 00 p?@?????
0x7fffffffe420: 28 e5 ff ff ff 7f 00 00 (???????
0x7fffffffe418: 38 e5 ff ff ff 7f 00 00 8???????
0x7fffffffe410: a8 fa 40 e7 32 00 00 00 ??@?2???
0x7fffffffe408: cc 06 40 00 00 00 00 00 ??@?????
0x7fffffffe400: 40 e4 ff ff ff 7f 00 00 @???????
0x7fffffffe3f8: e8 f0 21 e7 ad fb ca de ??!?????
0x7fffffffe3f0: 10 e5 00 e7 32 00 00 00 ????2???
0x7fffffffe3e8: 00 43 77 e7 aa aa aa aa ?Cw?????
0x7fffffffe3e0: e5 07 40 00 00 00 00 00 ??@?????
0x7fffffffe3d8: 76 06 40 00 00 00 00 00 v?@?????
That looks scary. In fact, it doesn't look right at all now does it? Well, we must keep in mind that the architecture we're running on (x86_64) is little-endian. That is, when you have a multi-byte value it is stored with the most significant byte at the lowest address and the least significant byte at the highest address. In other words, the bytes show up in reverse order. Take main()'s local variable for instance. It holds 0xbeefbeef. We can see it on the stack at address 0x7fffffffe43c, in reverse order.
Now hopefully you notice some familiar values in there. It's worth mentioning that gcc aggressively pads the stack to ensure proper alignment of variables and increased performance. A simple google search for "gcc stack alignment" returns all sorts of interesting results and flamewars on what the correct approach should be. So, just get used to garbage being scattered all over the place.
That said it appears as though we oversimplified just a little too much. With modern versions of gcc on x86_64, the function arguments (if there aren't a lot of them) are often times passed via registers. In the function prelude, these values are read from the register(s) and pushed onto the stack after space has been allocated for the local variables. This also helps to prevent attackers from overwriting them in an attempt to accomplish some malicious goal. [3] For the things we're doing, it doesn't really matter - but it helps to know where they are.
Now things should be starting to make sense. We can see the entire stack frame for our hello() function. It starts at 0x7fffffffe400, where we see the previous base pointer preceded by the return address (note that main is located at 0x400678, and it makes sense that 0x4006cc would still be in that function). After the base pointer are the local variables (and some padding), finally followed by the function arguments.
Your first buffer overflow
On with the destruction. Let's tweak our program from above just a little bit...
#include "walk.c"

void hello(int value) {
  int local = 0xdecafbad;
  char buf[16];

  walk(&local+4, 64);

  printf("Please enter a string: ");
  scanf("%s", buf);
  printf("You entered %s!\n", buf);

  walk(&local+4, 64);
}

int main(int argc, char *argv[], char *envp[]) {
  int local = 0xbeefbeef;

  printf("Address of main is %p\n", main);
  printf("Address of local is %p\n", &local);

  hello(0xaaaaaaaa);

  return 0;
}
Now when we run it and, for instance, input "Hello" we can see it in the buffer allocated on the stack...
$ gcc -fno-stack-protector -z execstack -o doit doit.c
$ ./doit
Address of main is 0x400767
Address of local is 0x7fffffffe43c
0x7fffffffe410: a8 fa 40 e7 32 00 00 00 ??@?2???
0x7fffffffe408: bb 07 40 00 00 00 00 00 ??@?????
0x7fffffffe400: 40 e4 ff ff ff 7f 00 00 @???????
0x7fffffffe3f8: e8 f0 21 e7 ad fb ca de ??!?????
0x7fffffffe3f0: 10 e5 00 e7 32 00 00 00 ????2???
0x7fffffffe3e8: 00 43 77 e7 32 00 00 00 ?Cw?2???
0x7fffffffe3e0: 01 09 40 00 00 00 00 00 ??@?????
0x7fffffffe3d8: 67 07 40 00 aa aa aa aa g?@?????
Please enter a string: Hello
You entered Hello!
0x7fffffffe410: a8 fa 40 e7 32 00 00 00 ??@?2???
0x7fffffffe408: bb 07 40 00 00 00 00 00 ??@?????
0x7fffffffe400: 40 e4 ff ff ff 7f 00 00 @???????
0x7fffffffe3f8: e8 f0 21 e7 ad fb ca de ??!?????
0x7fffffffe3f0: 10 e5 00 e7 32 00 00 00 ????2???
0x7fffffffe3e8: 00 43 77 e7 32 00 00 00 ?Cw?2???
0x7fffffffe3e0: 48 65 6c 6c 6f 00 00 00 Hello???
0x7fffffffe3d8: 67 07 40 00 aa aa aa aa g?@?????
$
Interesting. What happens if we keep going?
$ ./doit
Address of main is 0x400767
Address of local is 0x7fffffffe43c
0x7fffffffe410: a8 fa 40 e7 32 00 00 00 ??@?2???
0x7fffffffe408: bb 07 40 00 00 00 00 00 ??@?????
0x7fffffffe400: 40 e4 ff ff ff 7f 00 00 @???????
0x7fffffffe3f8: e8 f0 21 e7 ad fb ca de ??!?????
0x7fffffffe3f0: 10 e5 00 e7 32 00 00 00 ????2???
0x7fffffffe3e8: 00 43 77 e7 32 00 00 00 ?Cw?2???
0x7fffffffe3e0: 01 09 40 00 00 00 00 00 ??@?????
0x7fffffffe3d8: 67 07 40 00 aa aa aa aa g?@?????
Please enter a string: Hello!_uh_oh._I'm_giving_you_more_than_15_chars!
You entered Hello!_uh_oh._I'm_giving_you_more_than_15_chars!!
0x7fffffffe410: 00 fa 40 e7 32 00 00 00 ??@?2???
0x7fffffffe408: 35 5f 63 68 61 72 73 21 5_chars!
0x7fffffffe400: 65 5f 74 68 61 6e 5f 31 e_than_1
0x7fffffffe3f8: 5f 79 6f 75 5f 6d 6f 72 _you_mor
0x7fffffffe3f0: 6d 5f 67 69 76 69 6e 67 m_giving
0x7fffffffe3e8: 68 5f 6f 68 2e 5f 49 27 h_oh._I'
0x7fffffffe3e0: 48 65 6c 6c 6f 21 5f 75 Hello!_u
0x7fffffffe3d8: 67 07 40 00 aa aa aa aa g?@?????
Segmentation fault (core dumped)
Ahhh victory. So now we know that if one encounters code that fills a buffer in an unbounded fashion, all we have to do is give it too much data and the program will most likely crash.
Why? Well, it should be fairly clear at this point that in the process of writing past the end of the buffer (overflowing it) we overwrote the return address with an invalid value. When the function returned, it loaded this value into RIP and proceeded to fault on it.
Sounds plausible, but we may have also caused a crash in a different way. We also overwrote the old stack frame pointer. On return, that was also loaded into RBP and if the value is incorrect and/or improperly aligned that could also cause the program to crash (usually with a Bus Error).